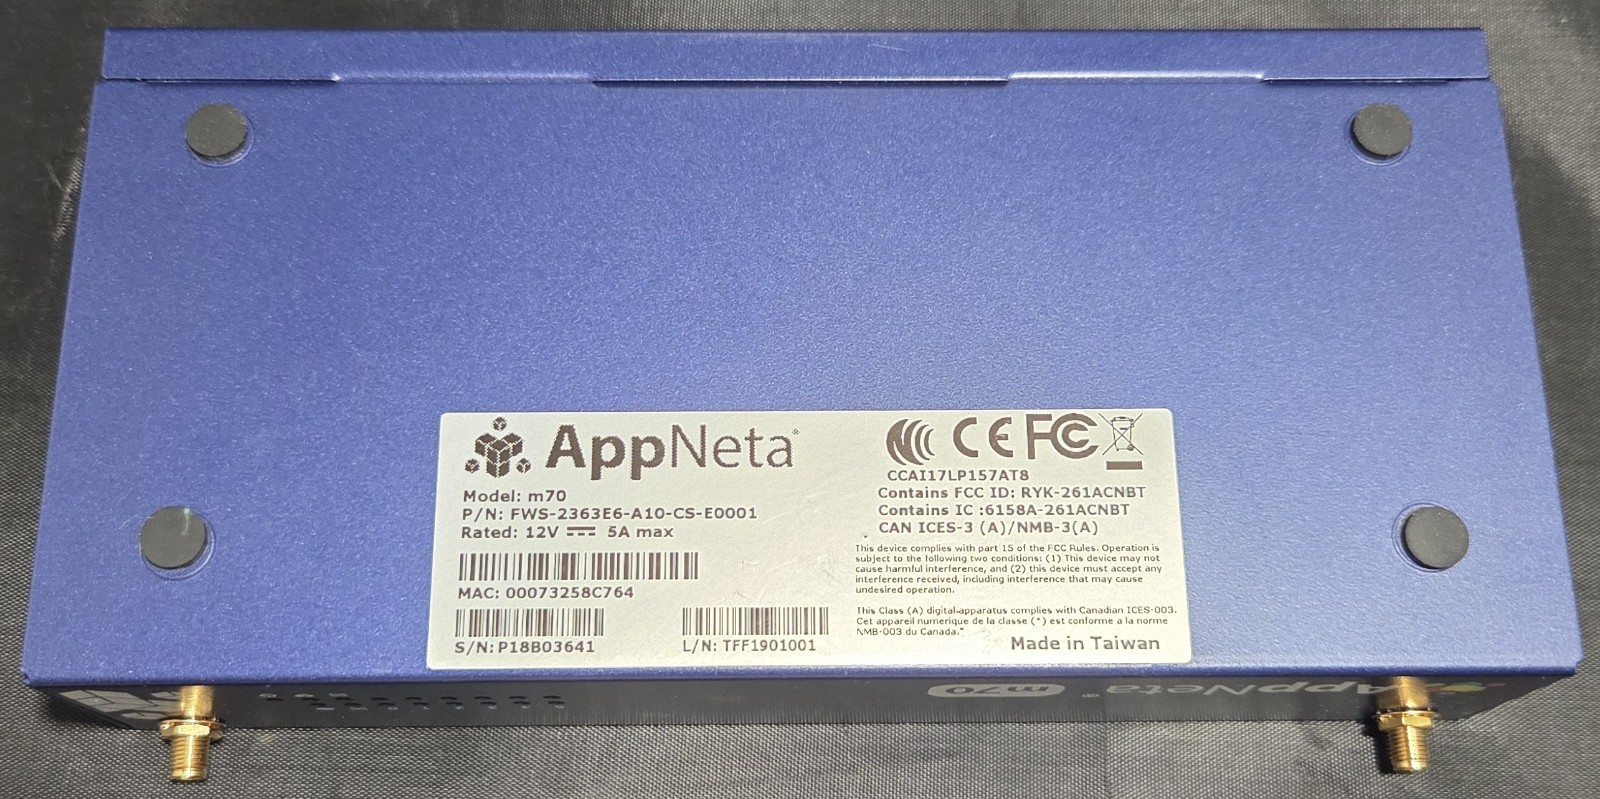
Testing & Verification: This appliance was powered on and tested immediately prior to packaging. The unit was factory reset and de-provisioned — confirmed via the local configuration UI, which shows "Monitoring Point Connected: No" and "AppNeta Server URL: n/a," meaning it is not registered to any prior organization's monitoring account. Screenshots of the configuration page and physical unit are included in the listing photos. The serial number and MAC address shown in listing photos match the physical unit shipped. Please compare the serial number on your received item to the listing photos before use.
Diagnostic Summary (Local Configuration UI, post-reset):
- Software Version: 15.2.2.55557
- Kernel: Linux 6.1.56-amd64-ani1
- Monitoring Point Connected: No (expected — unit was factory reset to clear prior provisioning)
- SSL Tunnel Connected: No (expected, same reason)
- NTP Synchronized: Yes
- CPU Load: 0.27, 0.11, 0.02 (idle/nominal)
- Available Memory: 92.1% (14.4 / 15.6 GB)
- Available Disk: 31.8% (9.1 / 28.5 GB)
- All front-panel status LEDs (port, bypass, health, power) confirmed lit and normal at time of photos
What's Included: 1x AppNeta m70 monitoring appliance, 1x FSP Group power adapter (model FSP060-DIBAN2, 100–240V AC input / 12V 5A DC output) with AC cord. No Wi-Fi antennas, no Ethernet cables, and no mounting/rack hardware are included unless otherwise stated in the listing photos.
Buyer Expectations: This is a bare enterprise network appliance sold as tested hardware only. It has been factory reset and is not currently provisioned to any AppNeta/Broadcom monitoring account — the buyer will need their own AppNeta/Broadcom Network Observability subscription and provisioning credentials to bring it online as an active monitoring point. Buyers requiring Wi-Fi functionality will need to supply their own compatible SMA antennas. Buyers should be comfortable with enterprise network appliance setup and provisioning, or have access to someone who is, before purchasing.